What this is
A ruin under rainforest is invisible to a camera. From above it is only trees. Lidar fires laser pulses through the gaps between leaves, times each echo, and draws the ground underneath. This page walks through how that works, step by step, using the kind of site Pietro Miotti’s agents found in NASA data over Mexico.
It exists because his article ends with a footnote: if you don’t know how lidar works, ask an AI to build a page that explains it. I pasted that footnote into Claude Code, and twenty minutes later this page was running. What happened after that is the case study linked above. The terrain, point cloud and animations here are synthetic, shaped like the hilltop in the article, not the survey data.
A flight line in cross-section. The survey aircraft never sees the pyramid. It only records when each echo came back, and from that the ground profile emerges one dot at a time.
1. Time of flight
Lidar is a stopwatch attached to a laser. The scanner fires a very short pulse of light, usually in the near infrared, and waits for the reflection. Light covers about 30 cm every nanosecond, so a clock that resolves a nanosecond resolves the range to about 15 cm (the pulse travels down and back, so the error is halved).
Range is half the round trip: d = c · t / 2. NASA’s G-LiHT instrument, the sensor behind the data used over Mexico, flies about 335 m above the ground and fires 300,000 pulses a second. Each echo returns in roughly 2.2 µs, before the next pulse even leaves the aircraft.
Drag the altitude. When the round trip grows longer than the gap between pulses, echoes from one pulse arrive while the next is already in the air, and the instrument has to sort out which echo belongs to which shot.
2. Three instruments, one coordinate
A range alone is just a number. To turn it into a point on a map the aircraft needs to know where it was and which way the beam pointed. Three systems work together on every shot.
The scanner sweeps the beam side to side with a rotating mirror, painting a strip of ground under the flight line. G-LiHT’s mirror covers a 60° fan, which at 335 m is a swath about 390 m wide. GPS, corrected against ground stations, pins the aircraft to within a few centimetres. An inertial measurement unit records roll, pitch and heading hundreds of times a second, because a one-tenth-degree tilt at that height shifts a point on the ground by about half a metre.
Every pulse is tagged with a timestamp. Range, scan angle, aircraft position and attitude at that timestamp are combined into one XYZ point. A survey like the one over the Maya lowlands yields billions of them.
3. Why trees don’t stop the laser
The beam leaving the aircraft is not a point. By the time it reaches the trees it is a spot a few tens of centimetres across. Part of that spot hits the top leaves and bounces back. The rest keeps going through gaps, hits branches lower down, and some fraction reaches the soil. The detector sees a train of echoes from one shot, spread out in time.
Modern scanners record several of these as separate returns: a first return from the canopy top, intermediate returns from inside the crown, and a last return which, often enough, is the ground. Under the dense forest in this story only a minority of pulses get all the way down. But with several pulses per square metre over hundreds of square kilometres, a minority is plenty.
Some instruments store the whole echo curve on the right (full waveform). Most store just the peaks as discrete returns, each tagged with its order: first, second, last.
4. The point cloud, and telling leaves from soil
Stack every return from every pulse and you get a point cloud: a 3D scatter of everything the laser touched. In a forest most points are leaves and branches. Hidden among them, the lowest points trace a continuous surface. Ground classification algorithms find that surface by starting from the lowest points in each patch and growing a smooth terrain outward, rejecting anything that sits too high above its neighbours to be soil.
The article shows exactly this check. Before trusting the images, the agents sliced the raw cloud across the hilltop. Green dots were leaves, brown dots the ground, and under 10 to 17 m of forest the brown dots traced a plaza, a pyramid and a courtyard. The shapes were on the ground, not an artefact of the trees.
A 120 m slice, heights to scale. Only a fraction of pulses reach the soil under the crowns, but the ground returns are enough to pin the 10 m pyramid, the flat plaza and the hollow that might be a reservoir. Interpolating the ground points gives a bare-earth model; interpolating the highest points gives the canopy surface.
5. Bare earth, lit from the side
The ground points are gridded into a digital terrain model: a raster where every cell holds an elevation. On its own a terrain model is a table of numbers. Two renderings make it readable. Height colour paints each cell by elevation, as in the article’s slider image. Hillshade computes how much light each cell would catch from an imaginary sun low on the horizon, so every slope, step and edge casts a shadow.
This is where the archaeology happens. Natural hills are rounded. Sinkholes are round. Roads are long and thin. Plazas, platforms and pyramids have straight edges and sharp corners. As the article puts it, nature doesn’t really do straight lines. Move the sun around and watch which features hold their shape from every direction.
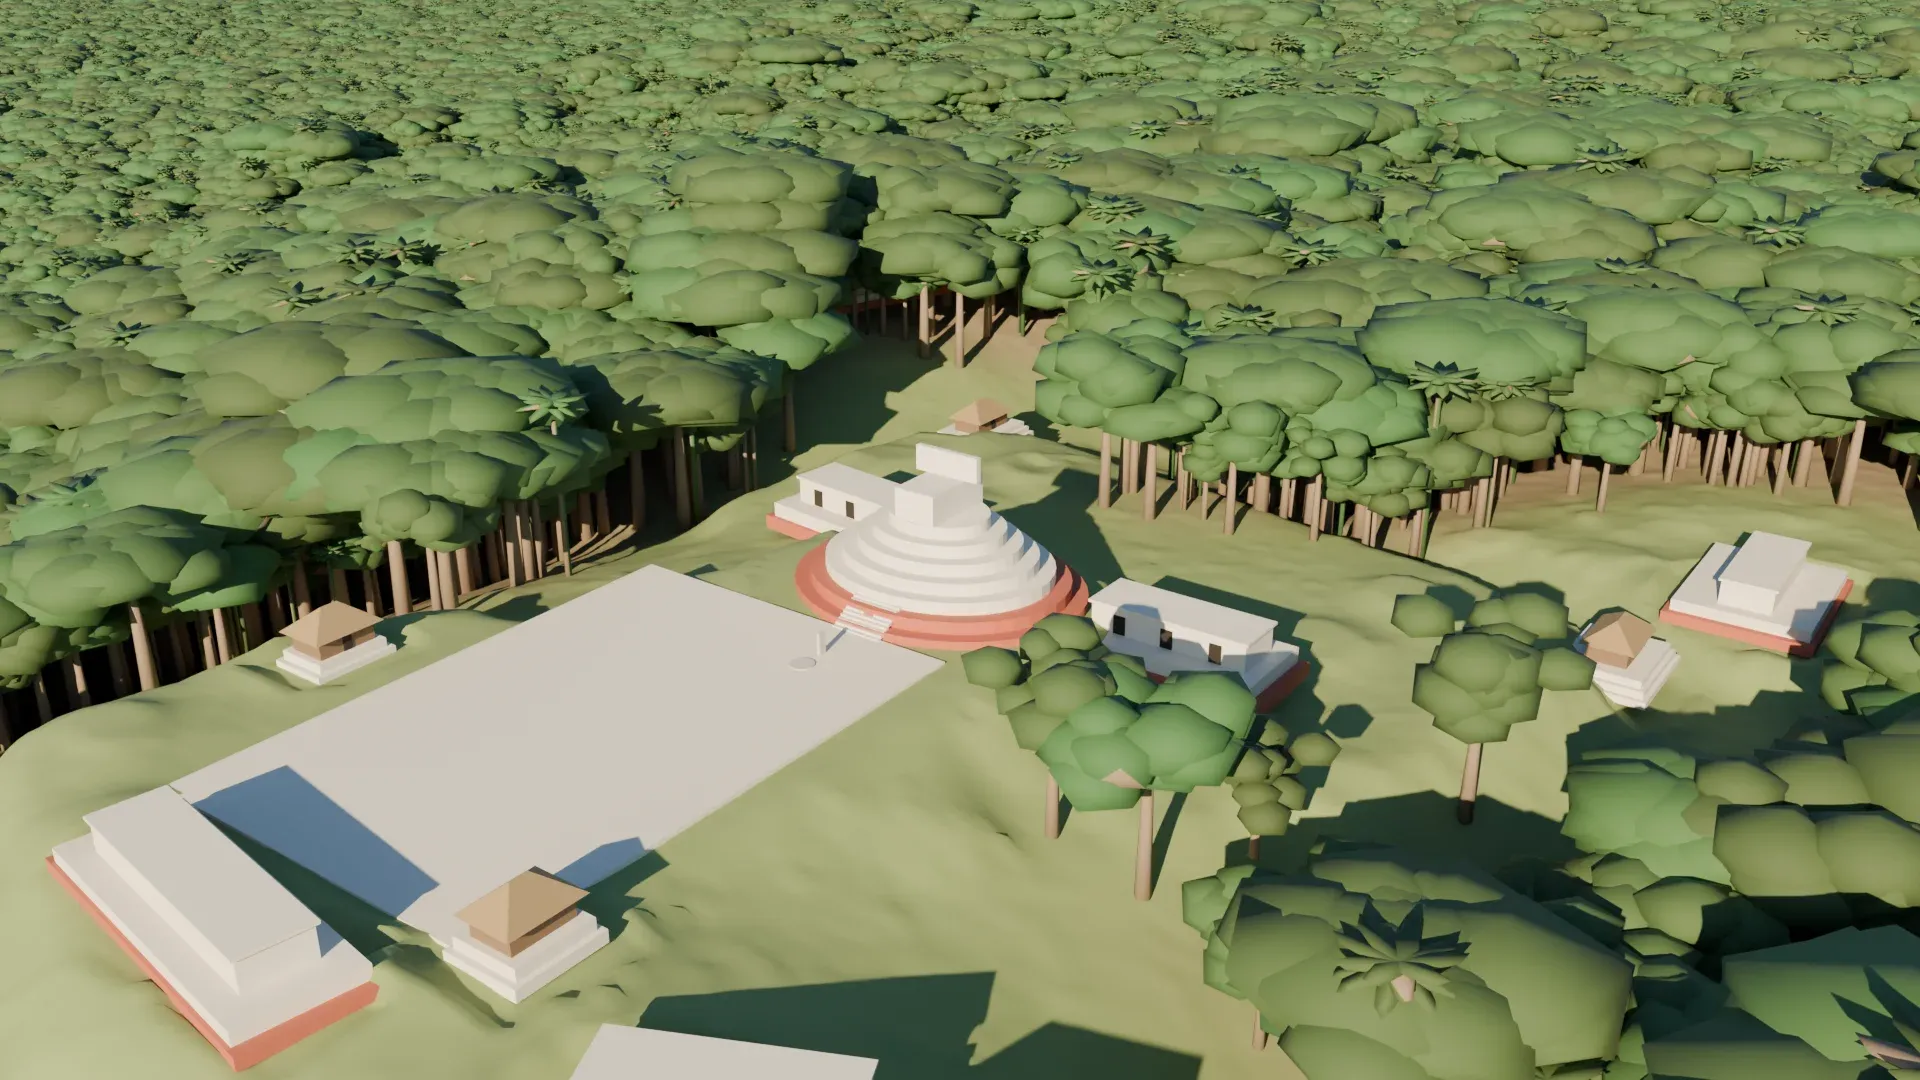
A synthetic 640 m × 480 m hilltop modelled on the site described in the article: a plaza on a cliff edge with an oval pyramid, a raised courtyard, a hollow, and three house platforms, among natural hills, a sinkhole and a track. The satellite view shows the same area as a camera would: a texture of tree crowns and nothing else. The article's own 3D view uses 1.5× vertical exaggeration, the default here.
6. The story this page is built on
Pietro Miotti, who is not an archaeologist, read about Hiram Bingham reaching Machu Picchu in 1911 and wondered what Bingham would do with today’s tools. Every AI assistant he asked said lidar. NASA’s G-LiHT campaign had flown large parts of the Maya region and published the data openly, so he set agents loose on it overnight.
Brainstorm. Peru is not covered by NASA’s lidar, Mexico is. Token created on the NASA portal, agents start on the strips.
19 OctoberThe strips, about 1,200 km² of jungle, were turned into images. 48 agents inspected them one by one, looking for pyramids, platforms and plazas while filtering out natural hills, sinkholes and roads. One hilltop on a cliff edge was not in any register.
20 OctoberThe agents sliced the raw point cloud to confirm the shapes were on the ground. The report was translated into Spanish and sent to INAH, Mexico’s National Institute of Anthropology and History.
21 OctoberINAH replied: no registered archaeological site at that location.
11 NovemberMiotti posted an update: the hilltop appears in a 2025 lidar study of Maya settlement, one of the papers his own article cites. Not in the register, but in the literature.
The data were collected in 2013 for forest and carbon research, not archaeology. Reusing environmental lidar for archaeology is a recognised method; the article points to Golden et al. 2016 for it, and to Auld-Thomas et al. 2024, who found an entire Maya city in Mexico the same way.
Where this comes from
- Pietro Miotti, My AI Agents Found an Unmapped Maya Site, the article this page is built around, and his update of 11 November.
- NASA Goddard’s G-LiHT (Goddard’s Lidar, Hyperspectral and Thermal imager); Cook et al. 2013 describe the instrument: a 1550 nm scanner, nominal 335 m flight height, 300 kHz pulse rate, 60° scan angle.
- Golden et al. 2016, on reusing lidar collected for environmental research in Maya archaeology.
- Auld-Thomas et al. 2024, the lidar discovery of a whole Maya city in Campeche, Mexico.
- Estrada-Belli, Canuto, Šprajc and Fernandez-Diaz 2025, New regional-scale Classic Maya population density estimates and settlement distribution models through airborne lidar scanning, the paper the hilltop turned out to be in.
Instrument figures are nominal values from the G-LiHT description. The terrain, point cloud and animations on this page are synthetic illustrations shaped like the site described in the article, not the actual survey data.