Well, it seems someone at Google is listening. Things can only get better.
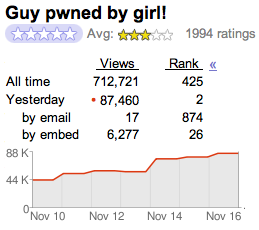
I was checking out the videos at The WorldTV Internet Charts and clicked on one of the Google Videos. After watching the video I noticed that, just below the star ratings, it said “All time views: 712,721 »”. So you know I had to click on the little chevron symbol to see what lay beneath these numbers.
And Voilà!

There they were… historic audience graphs for the last week, and a table showing the All time Views & Rank, as well as Yesterday’s Views & Rank, including how many were via email or embedded in blogs.
Hey, it’s not the Google TV Dashboard I wrote about, but it’s a start.
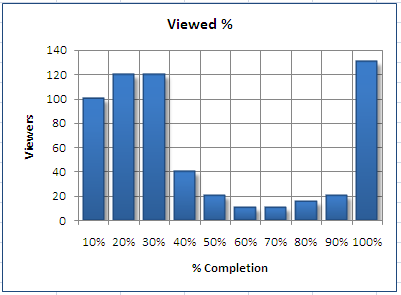
As a video producer or advertiser, I’d also like to know how many people watched the entire video and how long did the rest of the viewers watch. These graphs would look something like this (we could call it the “saddle-graph”):

The name, of course, comes from the saddle shape of the graph. I haven’t seen one of these but I think it’s safe to say that while many viewers would stop watching a video at the beginning, those that kept watching would tend to stay until the end, given the time they had already invested in the video. That’s why you get the peak at 100%. In television, you tend to see graphs like these for shows that tell a story (and thus capture the viewer), while for other types of content you see more irregular graphs.
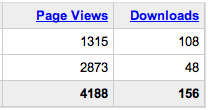
The Reports page for your uploaded videos still only shows a simple table with Page Views & Downloads. You can choose the time frame for the reports but that’s about all you get.

And the numbers you do get, don’t necessarily match the ones on the Video page. For example, my two videos of the Atlanta Aquarium show 1315 & 2873 Page Views on the Advanced Report page, but if I go to the actual link and watch the video, I see 1330 & 2957 respective All Time Views. Not exactly dependable, but I’m sure they will eventually get it right.
There’s more information at the Google Video Blog, including a great new way to add comments that link to exact points on a video (so if you think the funny bits begin after the first three-and-a-half boring minutes, you can link straight to them).
Want more articles related to this post? Check these out:
Technorati Tags: Advertising, [Content Delivery Networks](http://www.technorati.com/tag/Content Delivery Networks), [Data Analysis](http://www.technorati.com/tag/Data Analysis), Google, Ratings, Television, Visualization, [Web Video](http://www.technorati.com/tag/Web Video)
Let's Connect
If you want to hire me or get in touch about something or just to say hi, reach out on social media or send me an email.
Other blogs
Some other blogs where I've posted throughout the years. Most of these will eventually migrate here.